6 Storage - Why a graph?
We are producing lots of data every month. Hundreds of thousands of stops, hundreds of millions of observations, billions in total. That’s far too much to put in a csv. We need a database if we’re going to work with it, but what kind. ## “Relational” databases{-}
The go to option for databases is a “relational” database - I’ll get to the scare quotes in a moment. There’s good reasons for this, it’s an established technology with lots of problems already solved and lots of people are familiar with SQL (Structured Query Language) which is used to access it. So let’s see how it fits our data.
Data in relational databases are in tables, linked together with keys. So for instance we could have a table of “observations,” with a latlon, a speed, a time etc. It’d also have a column that is a key to a table called “segments” which shows which segment was used, and information about that segment, such as its class and speed limit. The observations tables would also have a key column linked to a table called trips, which can be linked to vehicles and adjacent stops for instance. A table of stops can also be linked to vehicles, and potentially a table of locations.
This is straight forward for a common kind of query we might want; finding out about speeds on a given road segment. We get the segments table and link it to the observations table and filter to that segment and whatever time period we want. Or we get a location we want and link it to the stops table and filter to see how many stops there were.
But we have another major kind of query we call “tours.” Recall that a trip, in our framework, is just whatever is between two stops. In regular speech though a “trip” is more like a journey between specific places. This might be a journey between Melbourne and Sydney, even if the truck stops for a while for a driver to sleep, eat or otherwise just rest. In our framework we call this a tour, and we have to define them differently based on specific purpose; a stop of 8 hours or more between Melbourne and Brisbane makes sense, but a stop that long between Canberra and Sydney probably means it’s two journeys back to back.
We need a to string stops together to define these tours, a query that won’t just link two rows, but an arbitrary number of stops that make up a tour. This isn’t impossible in SQL and relational databases, but it’s not easy either. Our data base is going to be used by data people, not computer scientists, and we don’t want to make it more hassle than is necessary.
There’s also another problem, even with the simple segment query I mentioned. Remember every time we match a ping to a road segment we also get a list of segments leading up to it. So we get a recorded observation and several imputed observations of road segments, but they are all associated with the same time stamp, latlon, speed and distance travelled. We could keep these as separate rows in a table, but we’re duplicating basically everything except the link to the segment table. That seems a waste of space and resources. Ideally we’d link one row in the observation table to several rows in the segment table. Again, that isn’t impossible, but it isn’t straightforward.
Graph databases
In the end we looked at graph databases instead. So what is a graph database? When I talked to people about this they went and did their own research and found a lot of explainers that started out with variations on “unlike relational databases, graph databases store data as a series of relationships.” That didn’t really help much! However it is true that the main way graph databases are different to relational databases is they are all about relationships. Now you get why I used the scare quotes on “relational database.”
Here, graph doesn’t mean a plot of data, if means a network. We already had to start thinking in graph terms when we looked at road networks.
Graph databases store information on nodes that are linked to one another by relationships. They’re most obviously used for things like social media networks A user is a node. A post by that user is a node. The user is linked to the post by an edge saying they wrote it. Another user is attached to the first user by an edge saying they follow them. That user as also attached to the post with an edge saying they liked it. Any query just finds a node they are interested in and follows the paths until they get the info they need.
So how does that look for us?
The segment queries and location queries are fairly easy. A road segment node is attached to any number of observation nodes by an edge saying the observation was on that segment. These observations in turn have any number of edges to segments showing all the segments they were recorded on or were imputed on. Likewise a location node, like a rest stop, is linked to any number of stops. You start at the segment or location node and follow the paths along the edges where you find the data.
But it’s the tour queries where graph logic helps us. Say we want to find all vehicles that moved between Melbourne and Brisbane. We have a set of parameters, say, the starting and ending stop must be at least an hour so they seem like destinations, and there can’t be any stop on the way more than about 16 hours. We also want to make sure the whole tour is less than, say, 48 hours lest we get trucks that go all around the country before arriving in Brisbane. The graph database first finds all stops in Melbourne. For each it then follows the edge saying “next stop.” Reaching the next stop it checks a few things. Is it more than 48 hours after the first stop? If so we stop and move on. Is it in Brisbane? We have a tour! Is it not in Brisbane, but more than 16 hours in duration? If so we move on. If the stop isn’t in Brisbane yet, but also not more than 48 hours later and not too long, we follow the next stop edge, and repeat the process.
This is much more intuitive than the ways we could have done this in a relational database.
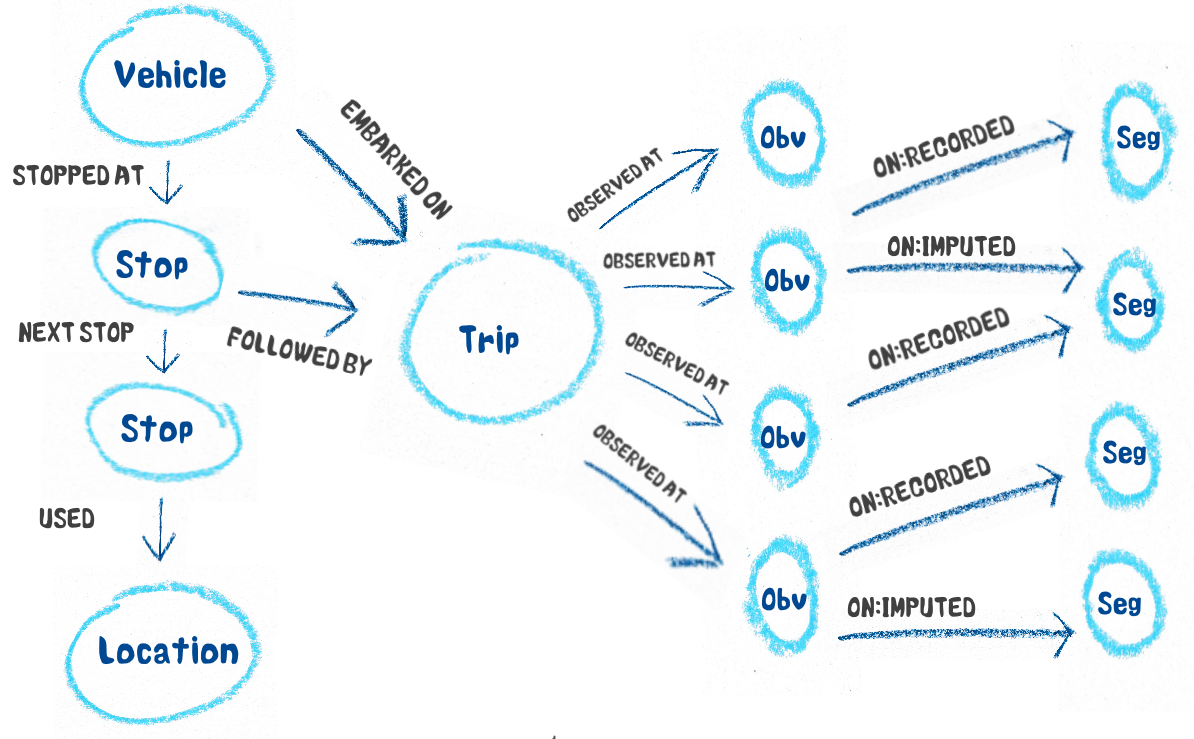
A simple representation of how our data can be shown in graph form
Which database,and which query language
Graph databases are fairly new, especially compared to the venerable relational database, so the technology isn’t settled in the same way and we had to make some choices. There are a bunch of other considerations with performance and cost we won’t consider here, but a major one for your project was the query language used - the way humans can ask the database for data. Relational databases are well settled on the well known SQL, but different graph databases favoured different languages; what was good for our purposes? There were three main candidates.
GraphQL
GraphQL was developed by Facebook for their own use and released as an open standard. It is the favoured language for databases like DGraph. It was designed for queries for a social media website and it shows. The queries look like JSON, which is commonly used to share data between web services, and connected nodes are nested in a structure of brackets in the same format the data will come out in. This is very good for embedding in web applications where the queries are written by machine, but it doesn’t quite capture the intuitive movement along paths on the graph; in the example below the difference between the attribute “name” and the edge “friends” relies on curly brackets. It isn’t well suited for data analysts trying to write their own queries.
{
  hero {
    name
    friends {
      name
    }
  }
}
Gremlin
Another option is Gremlin developed by Apache TinkerPop and is favoured by databases such as OrientDB. It was built for integration with applications written in Java and the many languages that emulate Java’s syntax, which is object oriented with dot syntax. You can roughly think of the database as a blob with a bunch of buttons. You can press the button that gives you all the segment nodes as another blob which has a button that will give you edges to observations. You keep pressing buttons on blobs until you get the button that returns the average of speeds. In practice these buttons are accessed with a dot (.) after the object and these are tied together.
Wikipedia describes the following example as “What 80’s action movies do 30-something programmers like? Group count the movies by their name and sort the group count map in decreasing order by value.”
g.V().
  match(
  __.as('a').hasLabel('movie'),
  __.as('a').out('category').has('name','Action'),
  __.as('a').has('year',between(1980,1990)),
  __.as('a').inE('rated').as('b'),
  __.as('b').has('stars',5),
  __.as('b').outV().as('c'),
  __.as('c').out('occupation').has('name','programmer'),
  __.as('c').has('age',between(30,40))).
  select('a').groupCount().by('name').
  order(local).by(valueDecr).
  limit(local,10)
You can puzzle over this for a while but it’s still not great for our purposes. You need to pay attention to see when it switches between following edges and accessing attributes because they both uses dots. Data analysis and statistics isn’t really favourable to object orientated languages in general, so, like GraphQL, what is friendly to application developers isn’t friendly to our users.
Cypher
We eventually settled on Cypher, developed by Neo4j for their own database and released as an open standard. It incorporates the structure of the graph directly into its syntax. For example this is how we might query the average speed on a segment by hour of day.
MATCH (s:Segment{osm_id: $SEGMENT_ID"})<-[:ON]-(o:Observation)
RETURN o.datetime.hour, mean(o.imputed_speed) as average_speed
Hopefully this is intuitive to you. We’re looking for two kinds of nodes, Segment and Observation attached by an edge labelled ON. This is visually apparent, and the edge even has an arrow showing the observation is on the segment and not the other way around. In this example we’ve restricted the Segment observation to one with the segment ID we want. We return attributes from nodes with dots, and even attributes of attributes, for instance extracting the hour from the datetime on the observation. By returning an attribute next to a function (here mean) the query does that function separately on each value of that attribute.
So the different bits are clear syntactically. There are nodes that look like (Node), edges that look like -[:EDGES]->, attributes that look like Node.attribute and functions that look like function(). This makes writing queries much easier for our data analyst users.
So we have have our data in the database, and we can do some work.